collapser / systems-design lab
A gRPC sidecar that collapses duplicate in-flight requests into one backend call.
I built this to learn how request deduplication, Docker and Kubernetes behave together not just how they are supposed to work on a diagram. This page records the design, the local infrastructure, the measurements and the mistakes.
System at a glance
The problem is a small version of the thundering-herd problem: a burst of identical reads can overwhelm a backend even though one answer would satisfy every caller. Collapser is the deduplication layer between those callers and the backend.
In Kubernetes, Collapser is a real application sidecar: it runs in the
same pod as the backend, receives gRPC requests on port
50052, and calls the backend on
localhost:50051. The application path needs no external
service; Prometheus and Grafana are optional local observability
containers deployed alongside it.
What it does
When several callers ask a service the same question at the same time, the service answers it once per caller. The proxy sits in front and gives them all the same answer from a single backend call.
The first request for a given key calls the backend. Anything arriving while that call is in flight waits on the same result instead of starting its own. A short result cache (100 ms) covers the gap just after a call finishes.
A normal gRPC service does not know that two independently arriving requests are the same request. That is the gap this sidecar fills.
Local infrastructure: Docker → kind
This is a reproducible local lab, not a cloud deployment. kind creates Kubernetes nodes as Docker containers, so Docker is both the image builder and the machine that runs the cluster. No image registry is needed.
| Step | What happens | Why it matters |
|---|---|---|
| 1. Build | Multi-stage Dockerfile produces the Collapser sidecar and backend images. | Same artifacts locally and in Kubernetes. |
| 2. Create cluster | kind creates a local Kubernetes cluster inside Docker. | Real pods, Services and container networking on one machine. |
| 3. Load + deploy |
kind load docker-image copies local images into
the nodes, then manifests create the workloads.
|
Fast iteration without publishing images. |
| 4. Measure | The included Go client sends identical requests; the backend counter verifies the result. | The collapse ratio is observed at the destination. |
# prerequisites: Docker, kind and kubectl on PATH make cluster #
            local Kubernetes cluster running in Docker make deploy # docker
            build → kind load → app + Prometheus + Grafana make demo # burst
            traffic and print backend calls make grafana # open the provisioned
            dashboard on localhost:3000 make cluster-down # remove the local
            cluster
In the Dockerfile, each target starts from scratch and
runs as a non-root user. In the Kubernetes manifests, the images use
imagePullPolicy: Never because kind already has the
locally loaded image.
Benchmarks
Three separate paths, benchmarked separately. Mixing them in one benchmark is the mistake I made first.
| Path | Time | Bytes | Allocs |
|---|---|---|---|
| Cache hit | 45.7 ns | 0 B | 0 |
| Joining an in-flight call | backend-bound | 54 B | 0 |
| Leading a call | 1,594 ns | 552 B | 10 |
| No Collapser (baseline) | 0.33 ns | 0 B | 0 |
Go 1.25.5, 11th Gen Core i7-1165G7, 8 threads. For the join path the number of allocations is what matters, not time. A waiter's wall clock is just however long the backend takes. Zero allocations there is the result of waiters sharing one channel instead of each registering their own.
Under load, in process
| Test | Requests | Backend calls | Errors |
|---|---|---|---|
| 10,000 concurrent, one key | 10,000 | 2 | 0 |
| 60 s sustained, 100 workers | 391,400 | 392 | 0 |
Race detector on. Goroutine count and heap were flat across 100,000 requests.
Run the Kubernetes demo
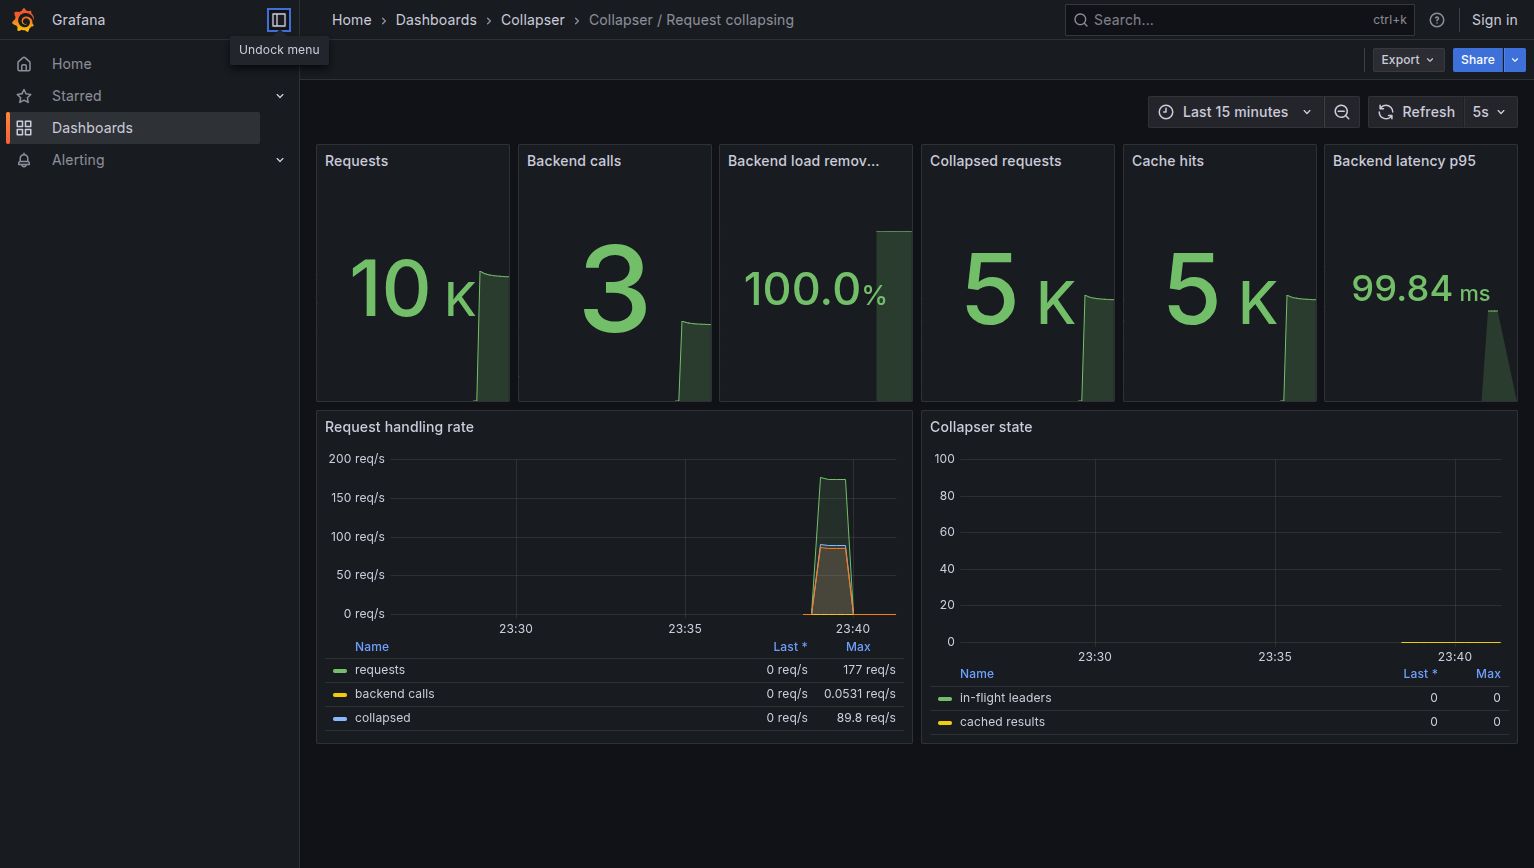
The local demo sends a burst through the Collapser Service into the sidecar container. It then prints the backend's own call count and the collapse ratio. That keeps the measurement honest: the sidecar cannot claim more load reduction than the backend actually sees.
make cluster && make deploy && make demo
What Grafana sees
The proxy exposes Prometheus metrics on port 2112. A
small local Prometheus deployment scrapes that endpoint every five
seconds, and the provisioned Grafana dashboard visualises the result.
No dashboard clicking or datasource setup is required:
make deploy creates both services, and
make grafana opens the dashboard on
localhost:3000.
What I got wrong
These were all in the version I had already written up before I went back and measured properly.
- My headline benchmark measured the wrong thing. The "high contention" benchmark used a backend slower than the cache TTL, so nearly every iteration was a cache hit rather than an actual collapse. It reported 61 ns/op; the dedicated cache benchmark reported 58. Same code path, and I had been quoting it as the collapse number.
- The collapse path was not allocation-free, so I made it one. Each waiter allocated its own channel and got appended to a slice. Measured honestly that was 3 allocations per request. Replacing it with a single channel the leader closes brought it to zero and deleted about 45 lines, including the locking that the channel now handles.
-
The default could serve one caller's data to another.
Two callers sending identical payloads shared a response even when
authenticated as different users. Headers the backend varies on
now have to be named in
COLLAPSER_KEY_HEADERSso those requests stay separate. This one bothers me most, because the code looked correct.
Limitations
- Server-streaming calls are treated as unary. Without a service descriptor the proxy can't tell them apart on the incoming connection, so only the first response frame comes back. Client-streaming and bidi are detected and skip collapsing entirely.
- Each replica collapses on its own, so N replicas can still make N backend calls for the same key. Sharing that state across replicas would cost the latency the whole thing exists to save.
-
The passthrough codec registers itself globally under the name
proto. That is what makes the proxy work without generated stubs, but it means the package can't be imported into a process that needs normal protobuf marshalling. - Everything here was measured on one laptop and a local cluster. I have not run it against real production traffic.